What is CML?
CML stands for Capital Market Line. CML tells you at what rate is your input returning you values, that is your average rate of growth in business. The line on the graph shows the extra returns an investor is getting in return for his investments for a given level of risk he opts for. Investors who are well-acquainted in the line of business generally put up large shares and expect good returns for their assets which the capital market line exhibits graphically.
In common words, it determines the degree of your profit in the market as per your investment. CML primarily shows the trade-off between risk and return for functioning portfolios. It very efficiently depicts the combined risk-free returns of all the portfolios.
People generally deduce that if the sharp ratio is above CML, you should invest in buying shares. However, if the sharp ratio is below CML you should sell your shares/assets.
What is SML?
SML stands for Security Market Line. This is also a line in the graph determining your rate of return but there’s a catch in this one. Here, the SML tells you about the market’s risk or that point in the graph which shows that your profits might be running at risk.
Fundamental businessmen/women generally use CAPM to keep a track of risk premiums, detect corporate finance decisions, detect undervalued and overvalued investments and compare various based on diverse sectors. Market economists use SMLs to understand and determine an investor’s behaviours in the investment line. The aims of investors is to amplify expected returns parallel to market risks.
Most importantly, SML is used to determine whether more assets/investments can be added to the existing market portfolio. The risk running individually in these diverse market portfolios tells the investor about his undervalued and overvalued investments and thus this system of calculation is known as systematic risk.

Source: https://efinancemanagement.com/investment-decisions/sml-vs-cml
Summary:
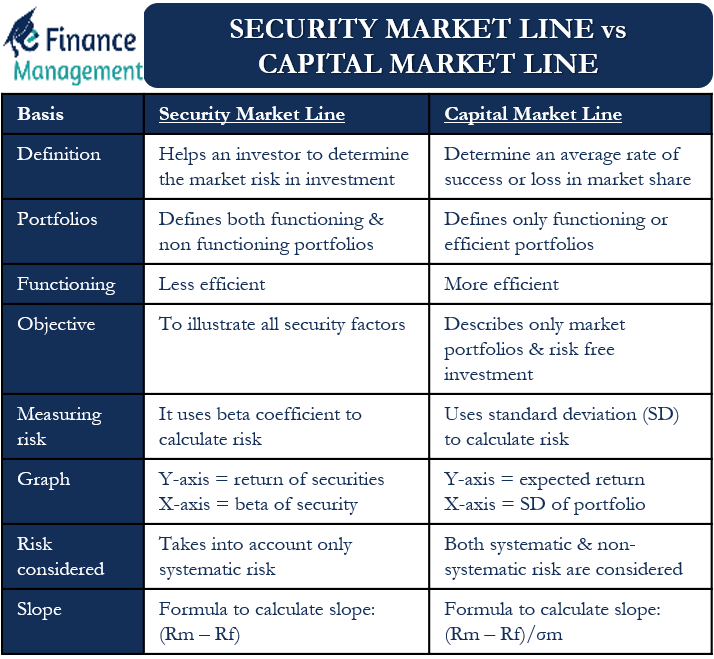
1. The CML is a line that is used to show the rates of return, which depends on risk-free rates of return and levels of risk for a specific portfolio. SML, which is also called a Characteristic Line, is a graphical representation of the market’s risk and return at a given time.
2. While standard deviation is the measure of risk in CML, Beta coefficient determines the risk factors of the SML.
3. While the Capital Market Line graphs define efficient portfolios, the Security Market Line graphs define both efficient and non-efficient portfolios.
4. The Capital Market Line is considered to be superior when measuring the risk factors.
5. Where the market portfolio and risk free assets are determined by the CML, all security factors are determined by the SML.
Source: http://www.differencebetween.net/business/difference-between-cml-and-sml/#ixzz7Bi8I9i7c
Biggest Resource: https://www.bionicturtle.com/capital-market-line-cml-vs-security-market-line-sml/
Copy
No Index
Comments
Post a Comment
Share your suggestions, ideas or thoughts