First effort to understand as well as explain Log-normal Distribution.
Let's go
A lognormal (log-normal or Galton) distribution is a probability distribution with a normally distributed logarithm. A random variable is lognormally distributed if its logarithm is normally distributed.
Skewed distributions with low mean values, large variance, and all-positive values often fit this type of distribution. Values must be positive as log(x) exists only for positive values of x.
The probability density function is defined by the mean μ and standard deviation, σ:
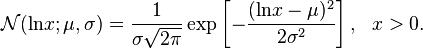
Source: https://www.statisticshowto.com/lognormal-distribution/
One of the most common applications where log-normal distributions are used in finance is in the analysis of stock prices. The potential returns of a stock can be graphed in a normal distribution. The prices of the stock, however, can be graphed in a log-normal distribution. The log-normal distribution curve can therefore be used to help better identify the compound return that the stock can expect to achieve over a period of time.
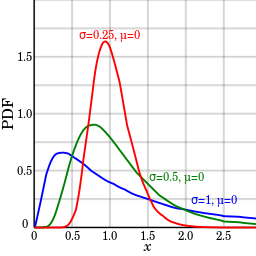
Note that log-normal distributions are positively skewed with long right tails due to low mean values and high variances in the random variables.
Source: https://www.investopedia.com/terms/l/log-normal-distribution.asp
Above my head source: https://www.sciencedirect.com/topics/engineering/lognormal-distribution
Skewed distributions with low mean values, large variance, and all-positive values often fit this type of distribution. Values must be positive as log(x) exists only for positive values of x.
The probability density function is defined by the mean μ and standard deviation, σ:
The shape of the lognormal distribution is defined by three parameters:
- σ, the shape parameter. Also the standard deviation for the lognormal, this affects the general shape of the distribution. Usually, these parameters are known from historical data. Sometimes, you might be able to estimate it with current data. The shape parameter doesn’t change the location or height of the graph; it just affects the overall shape.
- m, the scale parameter (this is also the median). This parameter shrinks or stretches the graph.
- Θ (or μ), the location parameter, which tells you where on the x-axis the graph is located.
Source: https://www.statisticshowto.com/lognormal-distribution/
Definition
A log-normal distribution is a statistical distribution of logarithmic values from a related normal distribution. A log-normal distribution can be translated to a normal distribution and vice versa using associated logarithmic calculations.
Understanding Normal and Lognormal
A normal distribution is a probability distribution of outcomes that is symmetrical or forms a bell curve. In a normal distribution 68% of the results fall within one standard deviation and 95% fall within two standard deviations.
While most people are familiar with a normal distribution, they may not be as familiar with log-normal distribution. A normal distribution can be converted to a log-normal distribution using logarithmic mathematics. That is primarily the basis as log-normal distributions can only come from a normally distributed set of random variables.
There can be a few reasons for using log-normal distributions in conjunction with normal distributions. In general, most log-normal distributions are the result of taking the natural log where the base is equal to e=2.718. However, the log-normal distribution can be scaled using a different base which affects the shape of the lognormal distribution.
In financial markets sense, Normal distribution cannot be used to model stock prices because it has a negative side and stock prices cannot go negative. Thus, log-normal distribution would come in handy in this case. It is positively skewed and bound by '0' on the lower side. (my)
Overall the log-normal distribution plots the log of random variables from a normal distribution curve. In general, the log is known as the exponent to which a base number must be raised in order to produce the random variable (x) that is found along a normally distributed curve.
Overall the log-normal distribution plots the log of random variables from a normal distribution curve. In general, the log is known as the exponent to which a base number must be raised in order to produce the random variable (x) that is found along a normally distributed curve.
Applications and Uses of Log-Normal Distribution in Finance
Normal distributions may present a few problems that log-normal distributions can solve. Mainly, normal distributions can allow for negative random variables while log-normal distributions include all positive variables.One of the most common applications where log-normal distributions are used in finance is in the analysis of stock prices. The potential returns of a stock can be graphed in a normal distribution. The prices of the stock, however, can be graphed in a log-normal distribution. The log-normal distribution curve can therefore be used to help better identify the compound return that the stock can expect to achieve over a period of time.
Note that log-normal distributions are positively skewed with long right tails due to low mean values and high variances in the random variables.
Source: https://www.investopedia.com/terms/l/log-normal-distribution.asp
Video source: https://www.youtube.com/watch?v=sPzPEeJ4OQ4
copy
not indexed
Comments
Post a Comment
Share your suggestions, ideas or thoughts